


.png?width=200&height=148&name=Menu%20C%20(2).png)

.png?width=307&height=228&name=Menu%20-%20D%20(1).png)

.png)

While the COVID-19 pandemic spotlighted the crucial importance of air quality in preventing virus transmission, what more workplace, real estate, and building leaders have discovered since then is just how powerful an impact air quality has on health, well-being, and, by extension, workplace performance.
Today, more than ever, buildings are planned, developed, and renovated to prioritize occupant health and well-being, with one of the top strategies being air quality optimization.
To help illustrate the scale at which air quality — indoor and outdoor alike — impacts health and business outcomes, we’ve gathered together 33 air quality statistics that every business needs to know in 2025. Let’s dive in!
Outdoor Air Pollution Prevalence and Threats

- Air pollution, specifically particulate matter, is the largest external threat to human health, reducing the average life expectancy by 1.9 years.
- Air pollution causes more deaths than terrorism, war, opioid overdose, homicides, HIV/AIDS, malaria, and obesity combined.
- The WHO reports that 99% of the global population breathes air that exceeds WHO pollution guidelines, and recently declared air pollution to be a global public health emergency.
- Air pollution is linked to 17.8% of the total annual deaths in India, generating economic losses equivalent to 1.36% of India’s GDP in 2019.
- Every 10 µg/m3 increase in short-term PM2.5 levels increases the relative risk of daily cardiovascular mortality by 0.4% to 1.0%.
- While policies for air pollution are effective — the Clean Air Act has prevented over 230,000 early deaths since 1990 — the growing number of contributors to air pollution puts these outcomes at stake.
Environmental Stress as a Key Contributor to Air Pollution

- New estimates indicate that over the next 30 years, the U.S. population’s exposure to PM2.5 pollution due to wildfires will increase by 51%.
- 15 of California’s 20 worst fires have occurred in the past 20 years, and we can expect these numbers to grow as climate change, poor forest management practices, and residential development deeper into flammable landscapes continue to prevail.
- During the 2020 wildfires in Washington, D.C., PM2.5 concentrations increased by 91.7 μg/m3 on average. Each week of wildfire smoke exposure was estimated to result in 87.6 cases of increased all-cause mortality, 19.1 increased cardiovascular disease deaths, and 9.4 increased respiratory disease deaths.
- Wildfire smoke is especially dangerous to human health, as it includes not only biomass but also toxic pollutants from burning houses, vehicles, and manmade materials. One study found that respiratory hospitalizations increased by up to 10% with a 10 µg/m3 increase in wildfire-specific PM2.5 — compared to a 1.3% increase in hospitalizations from the same increase in non-wildfire PM2.5 levels.
- Together, environmental stress and air pollution create an exponential increase in poor health outcomes. One study identified that an individual’s risk of death when exposed to both extreme heat and PM2.5 increases by 21%.
- Climate change is expected to increase the highest annual concentrations of ozone by over 2.3 ppb in the U.S., putting areas that currently meet air quality standards at risk of non-compliance.
- The increase in extreme weather events may soon overshadow current efforts in the U.S. to improve air quality, emphasizing the need for more aggressive climate control policies.
The Massive Scope of Indoor Air Pollution

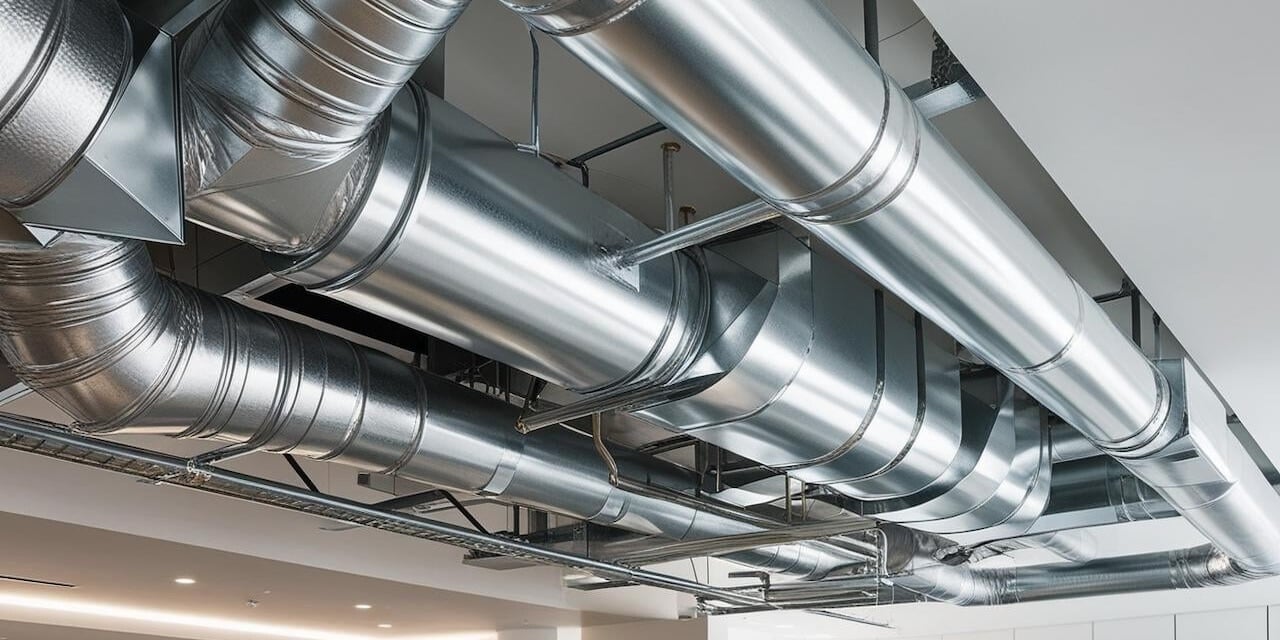
- Indoor spaces can be up to 5 times more polluted than the air outside from the buildup of formaldehyde from a wide range of items, including new textiles such as carpets, paint, glue, and cleaning products in residential buildings and asbestos, lead, and radon in commercial buildings.
- Over 20% of the general U.S. population report adverse health effects from air fresheners, which can contain toxic chemicals known as phthalates that disrupt hormonal function, interrupt reproductive development, and aggravate respiratory illnesses such as asthma.
- A study of commercial workplaces found that the main VOC sources in offices included photocopiers, printers, furniture, cleaning products, wall and floor coverings, and that emissions were 10 to 120 times higher when the computers were “on” than “off”.
- LCD screens, such as those found in older monitors or televisions, release heavy quantities of over 30 VOCS and 10 L liquid crystal monomers alone. Other culprits include printers, copiers, laptops, and computers.
- The average person spends 90% of their time inside — whether at home, work, school, etc. — which exponentially increases their risk of pollution-related health effects if the indoor environment doesn’t optimize air quality.
Costs and Consequences of Unhealthy Buildings

- The U.S. loses $22.8 billion each year from lost productivity due to current (suboptimal) ventilation levels.
- One study found that employees who work in an office with poor indoor air quality (IAQ) are 6% to 9% less productive, with larger impacts on performance seen in real-world settings.
- Sick Building Syndrome (SBS), which causes symptoms such as respiratory ailments, allergies, and asthma, occurs in 57% of offices.
- According to a recent analysis on ventilation rates and employee health, buildings with a lower ventilation rate have a 130% increase in sick leave.
- A working report from the EPA’s National Center for Environmental Economics found that just one µg/m3 increase in PM2.5 reduces labor productivity by between 0.6% and 1.9%.
- Compared to a building with 550 ppm of CO2, employees working in a building with 1,400 ppm of CO2 score 50% lower on cognitive functioning tests.
- Statistically significant declines in cognitive scores have been recorded in employees working in indoor spaces with the same CO2 and VOC levels found in conventional office buildings.
The Outsized Health and Business Impact of IAQ Optimization
- Harvard assistant professor Joseph Allen has estimated that the productivity benefits of improving air quality through ventilation are around $6,500 per person per year.
- It costs less than $40 per employee per year to double the ventilation rate. This small investment can lower sick leave by 20% and lead to an 8% improvement in cognitive functioning.
- The estimated payback period for improving IAQ is just two years. Based on one economic analysis, the benefits of IAQ optimization exceed the costs by a factor of nearly 60.
- The Lawrence Berkeley National Laboratory concluded that improvements made to indoor air quality can boost workplace performance by 10%.
- One Harvard study found that employees working in a well-ventilated office with low pollutant levels showed double the cognitive functioning of those working in spaces with average levels of the same pollutants.
- The same study found that the new building (which was designed to prioritize health and well-being) had a 42% reduction in SBS cases.
- A recent experiment discovered that reducing TVOC by 71.9% (from 1000 ppb to approximately 281 ppb) increased creative potential by 11.5%.
- A recent study showed that moving employees to a building designed with IAQ optimizations improved employee satisfaction with air quality by 32%.
Learn more about how indoor air quality data can be used to optimize employee health, enhance workplace productivity, and drive better business outcomes in our FREE eBook, The Business Case for Indoor Air Quality: