


.png?width=200&height=148&name=Menu%20C%20(2).png)

.png?width=307&height=228&name=Menu%20-%20D%20(1).png)

.png)

Data without action means very little. While data collection is an important first part, you can only drive real value from it by interpreting the data, reaching actionable insights, and taking the appropriate action.
This is true for any type of data-related project - and indoor air quality monitoring is no different. You are never monitoring for the sake of monitoring, but rather are looking for tangible ways to improve the workplace experience and drive better outcomes for employees and the business.
But how exactly do you put air quality data to use? It’s easier when you have the right set of hardware and software to collect data that’s accurate, comprehensive, and easy to understand; but you still need to close the loop and take action. Let’s look at 5 examples of Kaiterra customers who have done just that, and the ingenious ways they optimize their built environment and manage indoor air quality using real-time data.
These examples were covered in further depth in our recent webinar, which you can watch for free here: Interpreting IAQ Data in Healthy Buildings: Turning Insights into Action
1. Managing Ventilation During Wildfire Season
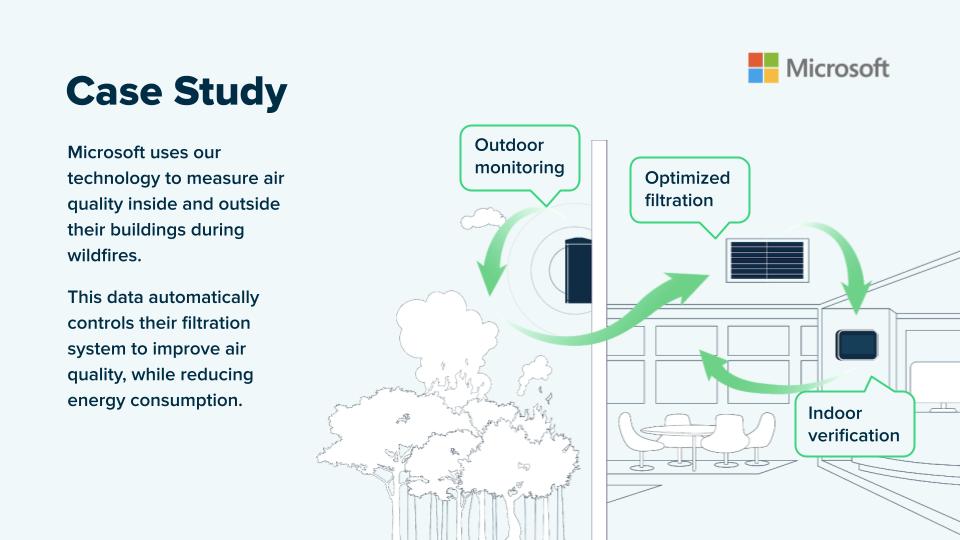
We’ve seen a great example of acting on IAQ data from our work with Microsoft. Their team uses air quality monitoring both inside and outside of their buildings in Seattle to optimize decisions around ventilation.
During wildfire season, air quality in the US West Coast - which is usually very good - can quickly decline to become one of the world’s worst. When the direction of the wind changes, Microsoft’s campus could suddenly become covered in smoke.
By monitoring air quality, they are able to make decisions in real-time - such as reducing the ventilation rate when ambient air quality declines, or even increasing the ventilation rate ahead of such an event. This allows the company to mitigate harms and ensure employees continue breathing the best possible air.
2. Combining IAQ and Occupancy Data
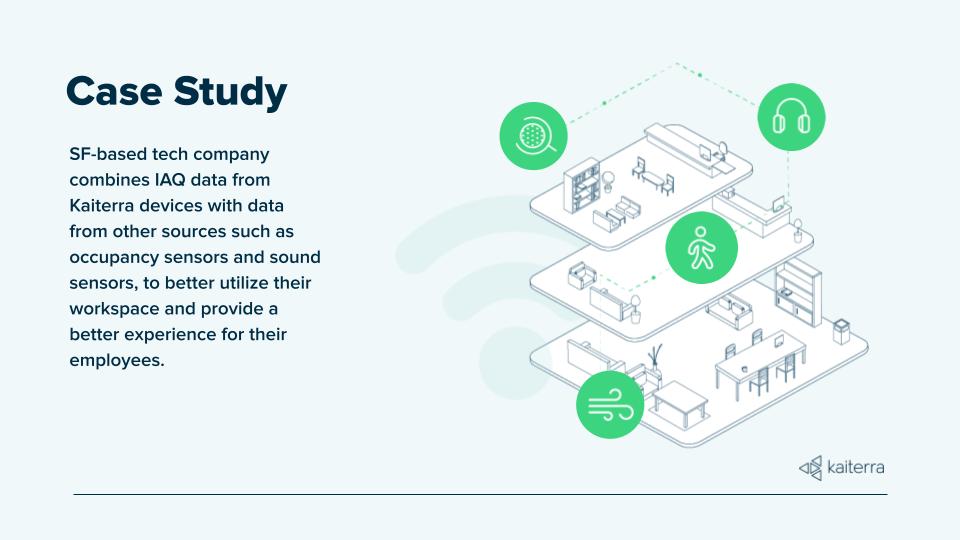
In this example, a San Francisco-based company uses Kaiterra’s air quality monitors as well as occupancy sensors. By combining these two streams of data, they are able to start identifying many potential sources of poor IAQ and improve the overall occupant experience - for example, by reducing overcrowding and adjusting HVAC levels in relevant areas of the building.
3. Identifying and Rescheduling Polluting Activities
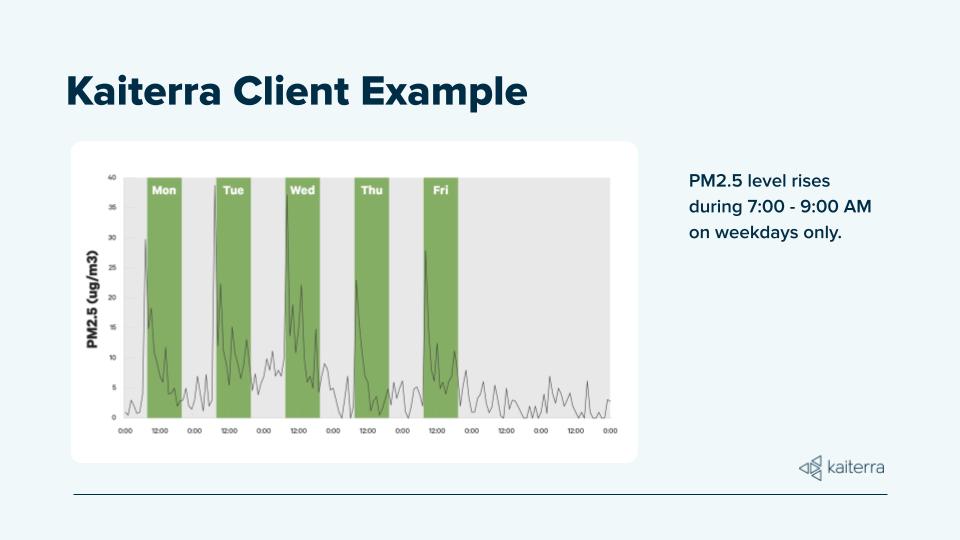
In this example, the company was monitoring particulate matter levels throughout the week. By reviewing the data, they could see that there’s a spike every morning, right before working hours start.
Often indoor cooking might be a culprit for rising PM2.5 levels, and in an office building this can be caused by cafeterias. However, looking at the chart, this explanation seemed unlikely because the peaks are always at the start of the day and not during lunch or dinner hours.
In this case, the rise in PM2.5 could probably be traced to cleaning, which often happens in the mornings right before the working day and involves a significant amount of vacuuming. Unfortunately, it also meant that as employees were going into the office, they were starting work at the hours when air quality was actually worse.
Realizing that the problem was mostly limited to a specific activity suggested a quick fix: conducting cleaning activities after the workday has ended, rather than before it starts, thus reducing employee exposure to particulate matter. Changing the patterns of human behavior is often a very effective way of managing indoor air quality.
4. Identifying VOC Variance in Different Spaces
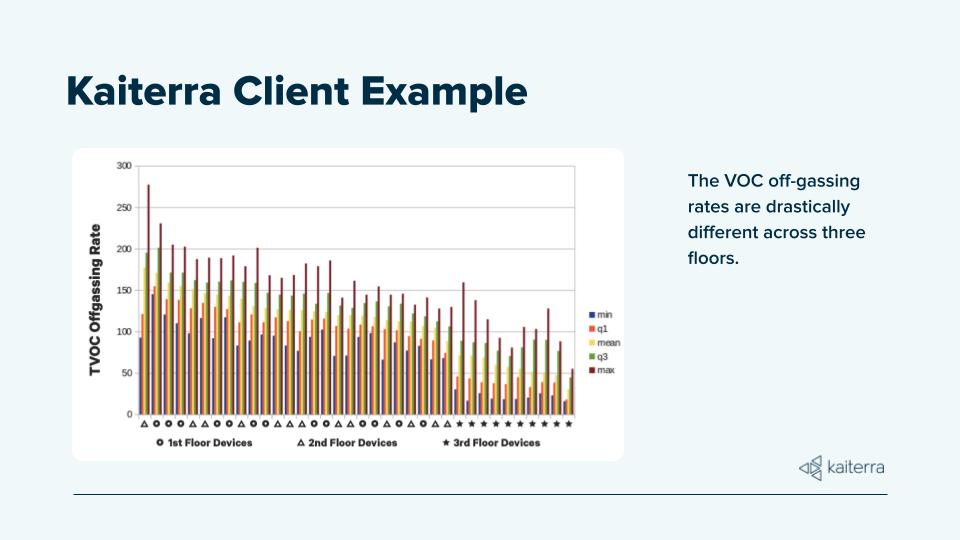
While this chart might be a bit cluttered, what it’s basically conveying is on the Y axis is the off-gassing rate of chemicals (measured by TVOC, Total Volatile Organic Compounds) - an output based on an algorithm used by Kaiterra looking at many different inputs from air in the space. Devices are implemented on the first, second and third floor, and each of these is charted above.
We can see that devices on the third floor are recording significantly better performance than those on the first and second floor. In each of the cases the space being measured is a conference room of similar size and usage patterns.
Chemical off-gassing occurs regardless of the way the space is being used during the day, so is not dependent on human behavior. This means there is some element within these floors that is causing more VOCs to be emitted during the day: this could be different furniture, or artwork painted on a wall. By identifying these differences, we can begin to narrow down the causes.
This type of insight can be really useful when planning the next office expansion or renovation, and can help companies avoid choices that degrade air quality for occupants.
5. Early Warning for HVAC Issues
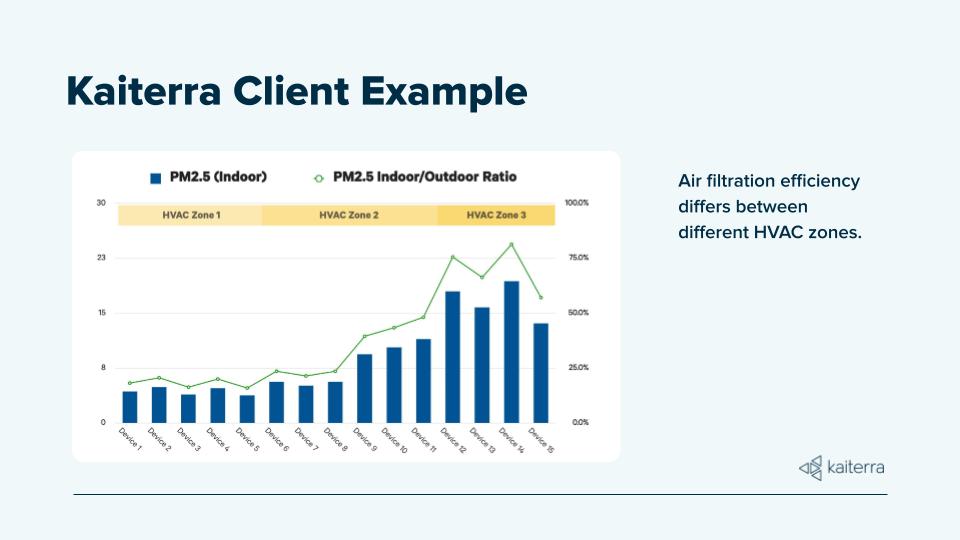
In this example, we’re looking at the efficiency of air filters across different HVAC zones within an office building. By tying monitors to specific air handlers, we can often find differences in performance - which could be due to faulty equipment or filters that need to be changed.
While many companies follow a rigid schedule for replacing filters based on manufacturer instructions, this might not be enough - since filter degradation is affected by the level of pollution that the specific filter is dealing with. Areas with high ambient air pollution might find that air filters need to be replaced more frequently.
Collecting air quality data allowed this company to proactively detect and address issues with its HVAC systems, minimizing employee exposure to poor quality air.
Learn More About Indoor Air Quality Management
Have these examples inspired you to find new ways to measure and improve the air in your office, school, or other building? Here are a few next steps:
- Read our guide to office air quality
- Watch the on-demand webinar on interpreting air quality data
Or you can always reach out to our team and discuss in detail: