


.png?width=200&height=148&name=Menu%20C%20(2).png)

.png?width=307&height=228&name=Menu%20-%20D%20(1).png)

.png)

The Kaiterra Dashboard is designed for you to stay in control and ahead of your building’s indoor air quality. When paired with your Kaiterra air quality monitor, this easy-to-use platform will be a powerful tool for identifying sources of pollution, and make data driven decisions intuitive and hassle-free.
With the Kaiterra Dashboard, you can:
- Turn your data into actionable insights in one click with our prebuilt reports
- Stay on top of changes with customizable alerts
- Track your improvements and share results in flexible formats
- Scale with ease by managing your devices by space, floor, and building
- Bring your stakeholders together to collaborate
- Keep your data consistent and secure
Let us take you through the platform!
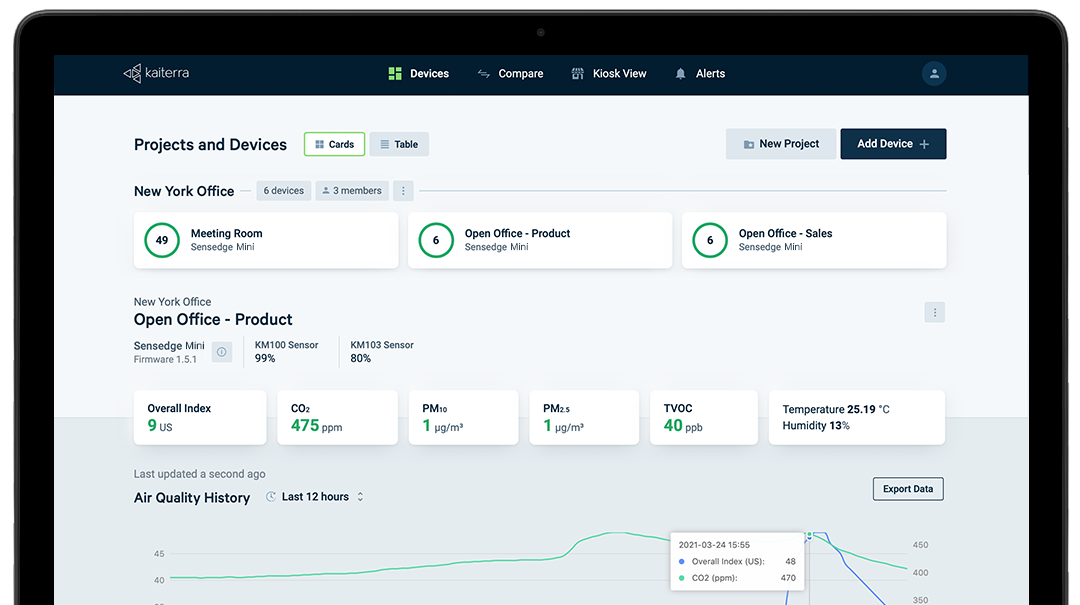
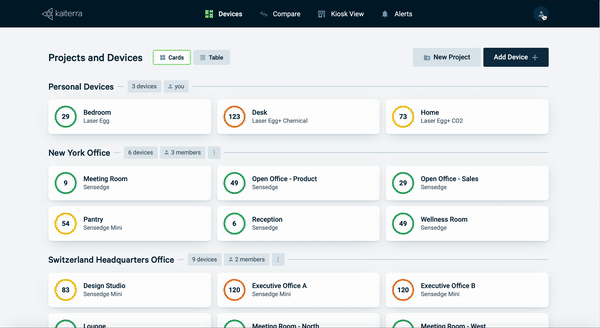
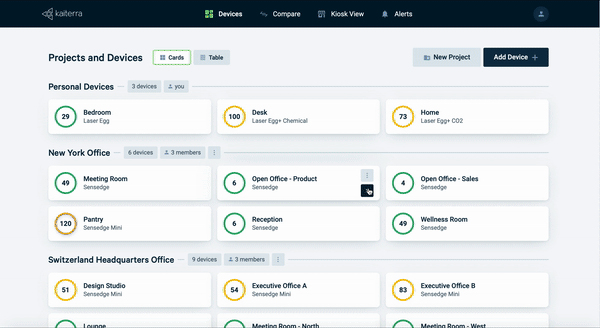
Monitor critical information at a glance
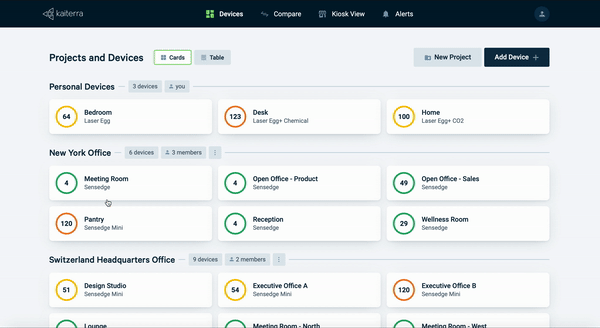
You can monitor and manage all your devices in one place on the Projects & Devices Overview page. Thanks to a color-coded indicator system, you can easily view the current status of your devices, and see which indoor pollutants are reaching dangerous levels at a glance.
- Choose how you view your devices.
Use the compact card view for a quick pulse check of your environment, or try out the new table view and sort devices by name or based on readings of different parameters, to quickly identify the ones that need special attention.
Manage projects and users with your Organization Account
With the new Organization Account feature, you can now add multiple users to your organization’s project(s)!
- Add and manage project members
If you’re managing more than one project (or a single large-scale project) with multiple collaborators, you will most likely want to limit access to areas that are relevant to each member’s work. With your Organization Account, you can now add users to the project(s) that are relevant to them and control which projects are visible to each user.
Want your Organization Account enabled? Go to your dashboard page and use the chatbot to file an upgrade request. If chatbot isn’t available to you, contact our support team here and we will find a time to upgrade your account.
Uncover actionable insights
Head over to the Device Details page and visualize current and historical data to uncover patterns and further improve the efficiency of your building's HVAC system, address your occupants' indoor environment complaints with live data, and be informed when action is necessary.
- Create and export certified performance reports.
Your minute-by-minute readings and historical data are available in formats recognized and supported by the WELL, RESET, and LEED standards. You can view detailed and customized reports for individual devices, and export & save them as .csv files.
- Compare different parameters.
Choose and compare key indoor air quality parameters including PM2.5, CO2, and TVOC against each other to identify pollution trends quickly and visually explore the data.
- Dive into critical device information
See critical information about your device, and take action before your device runs out of battery, or when the sensors need replacement.
Compare data from different devices and identify problem areas
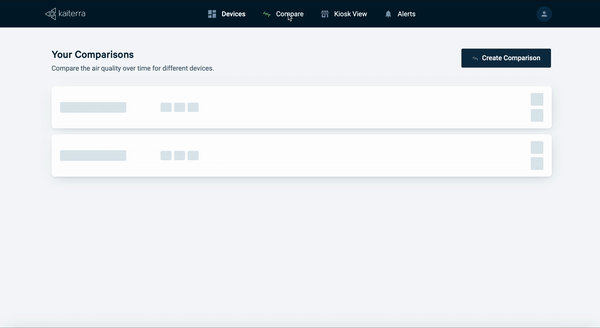
The dashboard enables you to assess trends and troubleshoot problem areas in your building by comparing different parameters, across multiple devices. Find out which parameters are contributing to the spikes in your AQI readings, and save comparison charts for future analysis on the Device Comparison page.
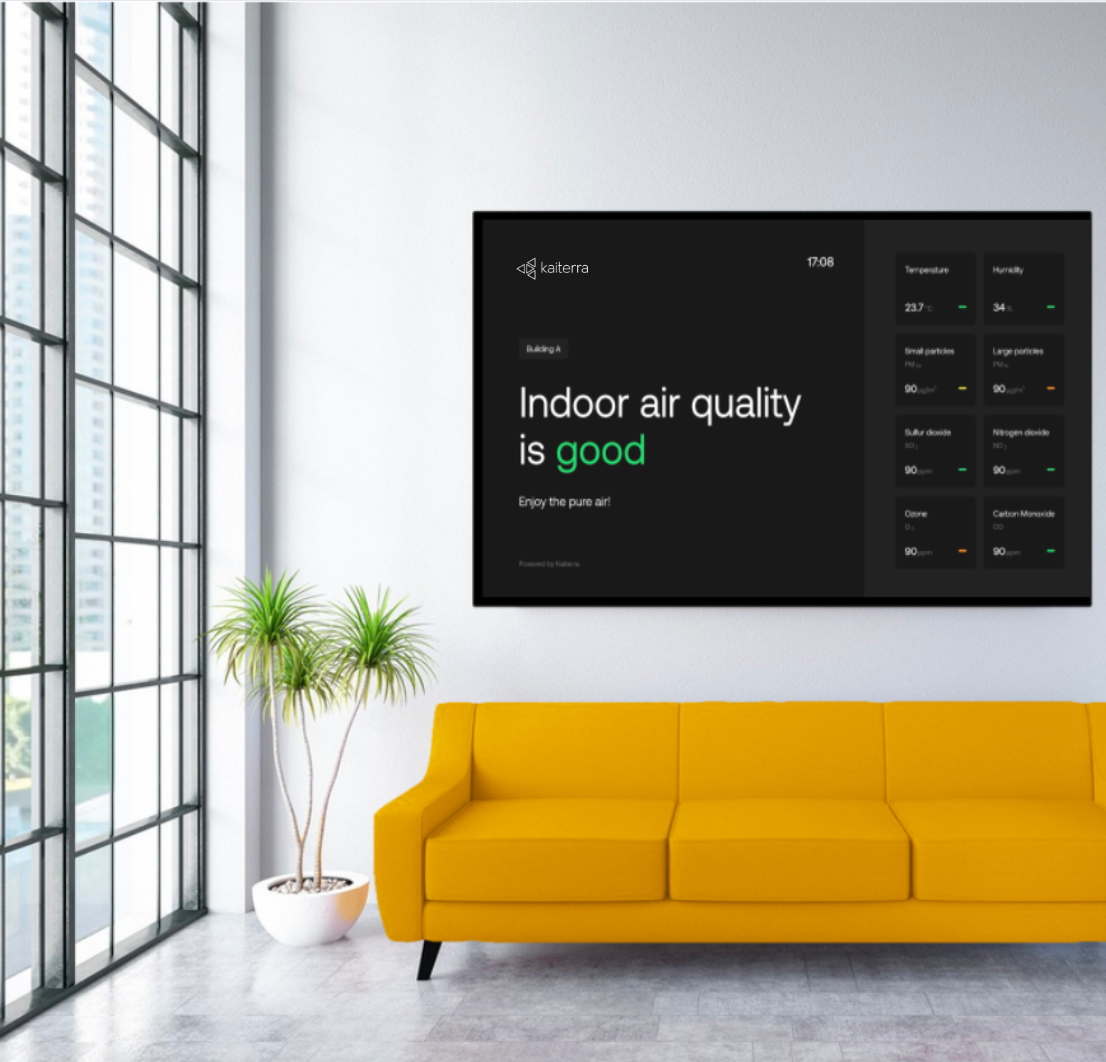
Communicate your efforts to improve air quality with the help of Kiosk View
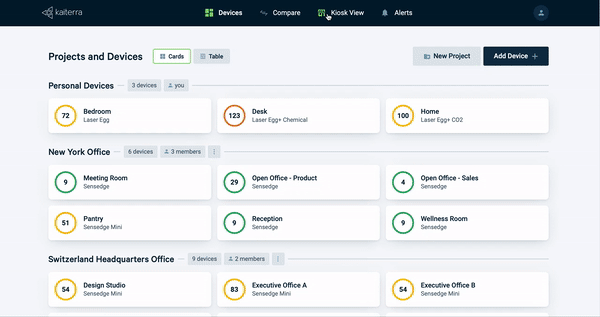
Choose the traditional dashboard layout, or try the new Kiosk View — optimized for display on larger screens— for a side-by-side comparison of indoor and outdoor data. Showcase your commitment to ensuring the health and safety of your employees, and communicate changes in the air quality levels with ease.
- Optimized for large-screen displays.
Showcase your air to a larger audience, display up to eight devices, and provide a holistic view of the air quality in your space.
- Display what matters to you.
Refine the Kiosk View main display by choosing only the parameter(s) that are relevant to you and your building, and see how your indoor environment is doing compared to the outdoors so you know when to take action and turn on your filtration system.
Want to see these (plus more) new features in action? Check out your new dashboard now!
- Interested in learning more about the Kaiterra enterprise products? Get a risk-free demo and learn how you can achieve a healthy and safe environment for your employees.