Newsletter
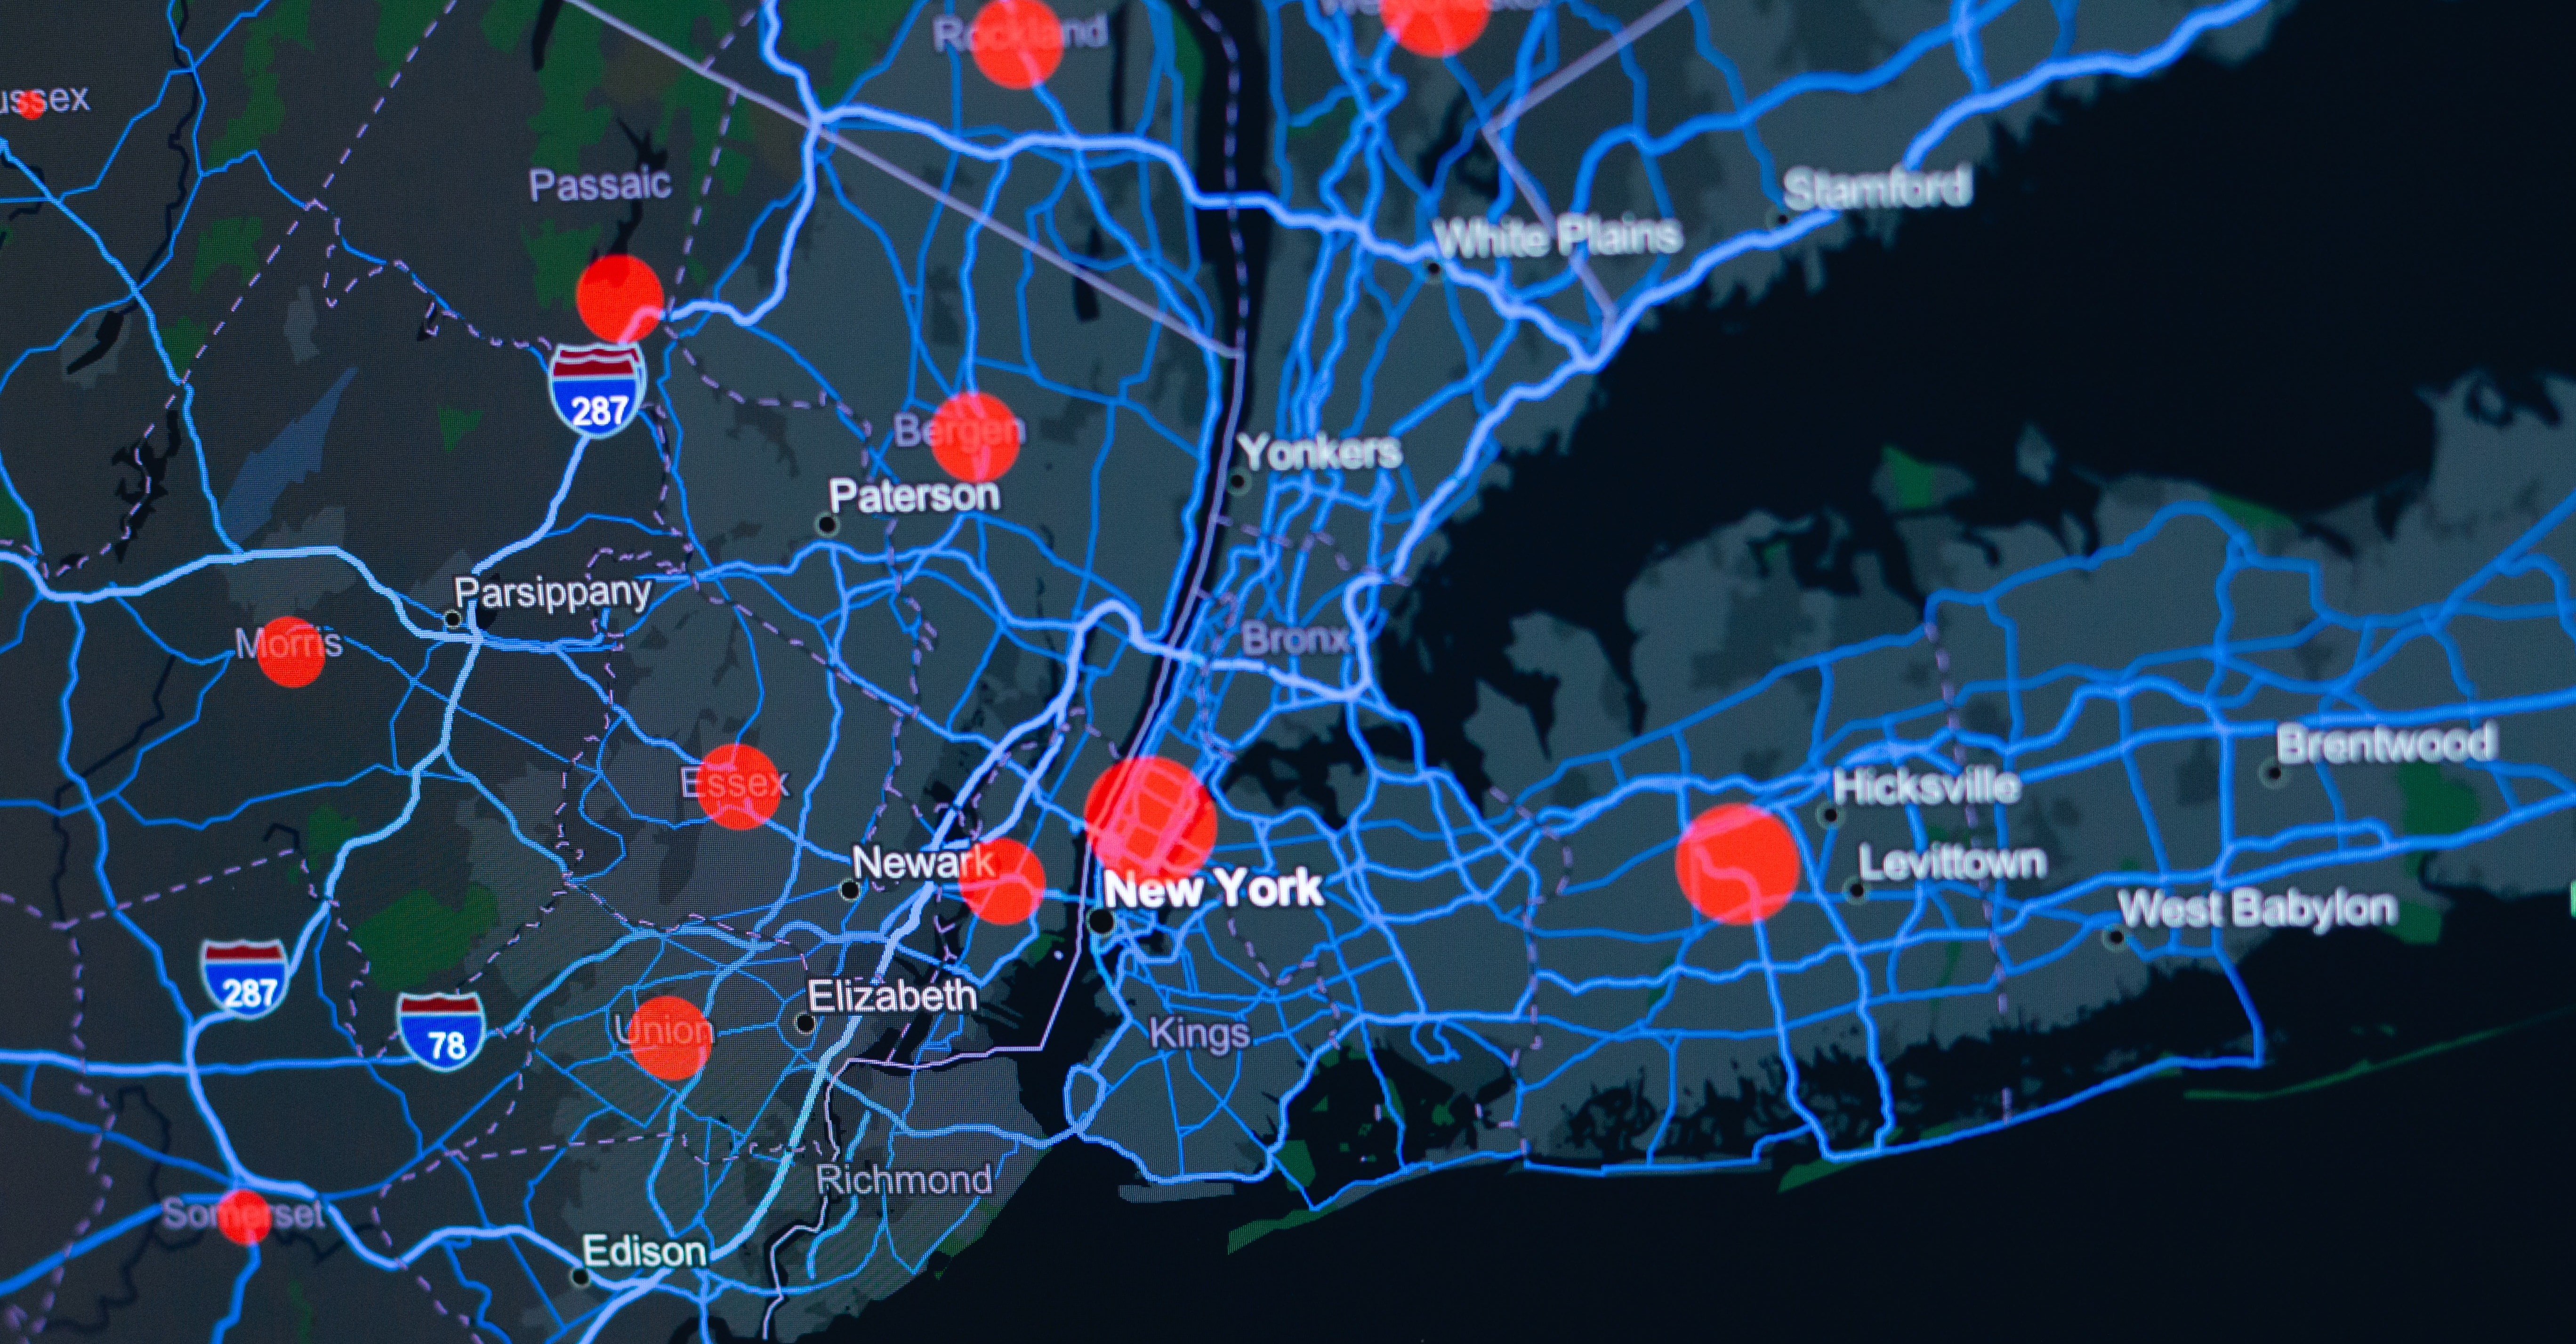
When the coronavirus pandemic first crossed the Pacific, New York City swiftly became the epicenter of COVID-19 cases in the USA. To combat the spread of COVID-19, the New York State government instituted the NYS on PAUSE program, which requires all non-essential businesses to close, non-essential public gatherings to be canceled, individuals to maintain six feet of personal space, and other measures.
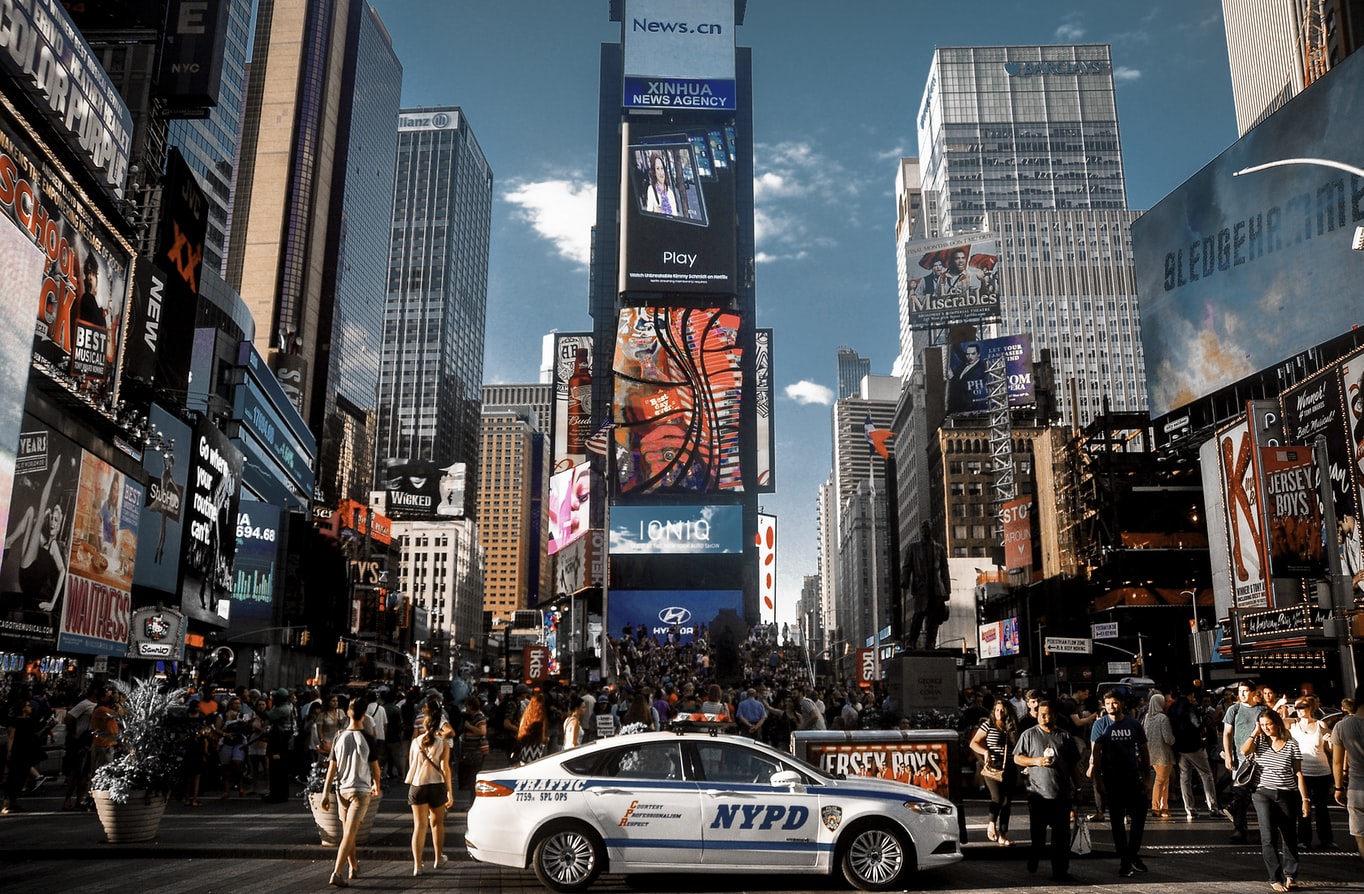
Since the onset of the coronavirus lockdown, tourist spots like Times Square have emptied.
Among the negative repercussions of global COVID-19 mitigation efforts, many of the world’s most polluted cities have seen some benefits. In New Delhi, India, the world’s most polluted capital, levels of nitrogen dioxide (NO₂) fell by almost 70%, and sources such as the National Geographic report that nitrogen dioxide levels in Northern Italy and China have also decreased significantly. Other air pollutants, such as carbon monoxide (CO), have also declined in the New York area, as reported by Columbia University researchers.
Another air pollutant of concern is particulate matter (PM2.5 in particular). Particulate matter is often overlooked, but it remains a significant health threat around the world. PM2.5 can stay in the air for long periods of time, and PM2.5 is light enough to be carried great distances by wind. Some research even indicates that particulate matter can carry the COVID-19 virus, so PM2.5 is a key air pollutant to study with the COVID-19 pandemic.
For this reason, we decided to take a look at NYC’s particle pollution, focusing on PM2.5, with the hope of uncovering the impacts of the recent COVID-19 lockdown. Many other studies show a reduction in NOx and other air pollutants, but does this trend apply to PM2.5 as well? We can’t just assume that all air pollution gets better just because one or two air pollutants decrease.
Likewise, particle pollution isn’t a consistent level across time or geography; in some places, air pollution can be seasonal and fluctuate year to year. How can we be sure that the COVID-19 lockdown is solely responsible for an air quality improvement? With so many factors at play, a simple comparison of 2020 averages to 2019 averages will not suffice. To truly know if the COVID-19 lockdown has improved PM2.5 pollution, we need to establish a broader context through air quality data.
Methodology & Results
Utilizing Kaiterra’s air quality database, we isolated New York City’s daily average PM2.5 values from four NYC boroughs, including Manhattan, Brooklyn, Queens, and the Bronx.
Manhattan
In Manhattan, we analyzed data from two monitoring stations: CCNY and IS 143. The CCNY station is located at the City College of New York in Harlem, and it also gathers ozone and carbon monoxide data. IS 143 is a public middle school located on 181st Street in Hudson Heights.
Within the first four months of 2020, PM2.5 levels decreased substantially. As shown in the graph below, there was a moderate correlation between time and PM2.5 level. The R² value indicates how well the trendline fits the data; for the graph below, the downward-sloping line fits the data fairly well.

Brooklyn
We utilized data from monitoring stations set up near PS 274 and PS 314, public schools located in Brooklyn. There was a five-day gap in data from PS 274 between March 1st and March 5th, which shows in the yellow line.

Like Manhattan, the downward trend fits the data well and shows a moderate correlation between date and PM2.5 level.
Queens
For Queens, we analyzed data from two locations by the Queens College campus, with one by the Long Island Expressway, and the other on the campus itself. These are labeled Queens near-road and Queens, respectively.

Unlike Manhattan and Brooklyn, the trendlines above are quite different. The PM2.5 levels near the expressway show a stronger downward trend than on-campus levels, and PM2.5 levels seem to vary more around the on-campus monitor.
Bronx
In the Bronx, we worked with one source of data, located at Intermediate School 74 at Hunt’s Point. Like Manhattan and Brooklyn, there is a moderate downward trend in the PM2.5 level.

Yearly Comparison
We have now established that PM2.5 pollution has improved as 2020 progressed. But does this mean anything? We need to establish if the improvement is unique to 2020.
We again used data from CCNY and IS 143 to see how 2020 compares with 2019. This analysis will help us see if the trend in 2020 is unique (and likely due to COVID-19), or if there is another factor to consider.

As we can see from the chart above, particle pollution declined during the first four months of both 2019 and 2020. COVID-19 did not appear in New York City until March of 2020, so the PM2.5 decline during the spring of 2019 was likely due to another factor. This same factor, such as weather or seasonal changes in human emissions, could also be responsible for the decline we see in 2020.
This idea is further corroborated by data from another station, IS 143, where the downward trend in 2020 is almost identical to 2019.

Lastly, we also targeted the date range after the NYS on PAUSE program went into effect through the end of April. This time period would see the greatest change in particle concentration if the lockdown was responsible.
We found that PM2.5 concentration over March 23rd to April 30th decreased almost 15% from 2019 to 2020. However, we also found that PM2.5 concentration during the same period decreased over 21% from 2018 to 2019. This further illustrates that the reduction in PM2.5 could be part of a larger trend, not the lockdown.
Why the COVID-19 Lockdown Isn’t Improving Air Quality Like We Think It Is
Since the onset of the coronavirus lockdown, there has been a clear improvement in air quality around the world, and New York City is no different. In every borough we looked at, PM2.5 levels declined over the first four months of 2020 at a substantial rate. In Manhattan alone, PM2.5 levels, on average, are half of those in January.
This decline in PM2.5 is undoubtedly good news, but we need to be cautious about ascribing every change in air quality to the coronavirus lockdown. Throwing around numbers without context can be misleading about the positive effects of COVID-19, regardless of accuracy.
Under Mayor Bloomberg’s PlaNYC, there have been substantial reductions in air pollution around New York City since 2007. The improvement in PM2.5 pollution from 2019 to 2020 certainly fits into this overarching trend, and definitively stating that the COVID-19 lockdown is responsible for all PM2.5 reductions sells these pollution reduction efforts short.
Similarly, the weather has always had an enormous impact on air pollution. Given that the COVID-19 pandemic and PM2.5 reductions merely correlate, the weather could still be responsible for some of the changes we have seen in NYC’s air quality.
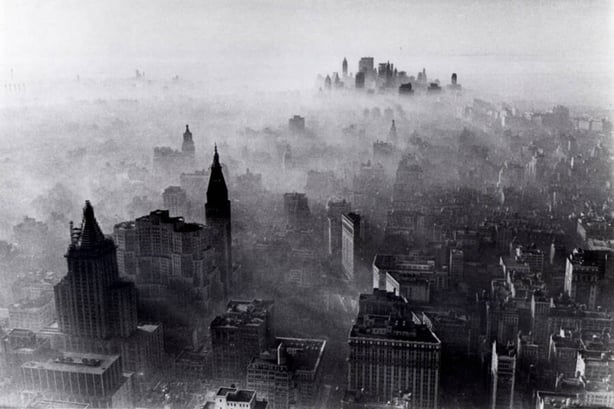
In 1966, a weather event called an inversion trapped air pollution over NYC, killing hundreds.
So, while the coronavirus lockdown certainly could have reduced PM2.5 levels in the city, the decline in PM2.5 could also be a seasonal change or part of a larger effort to curb air pollution. We simply need more time and data to fully understand the impacts of the coronavirus pandemic.
Air Quality Data: The Bigger Picture
If there is one thing we can conclude from all of this is that accurate, reliable data is crucial in uncovering air quality trends. As we mentioned in our discussion of Brooklyn, some chunks of data were missing in the air quality datasets provided by the New York State government. Some monitoring stations haven’t received data since mid-2019 (as of the writing of this article), and some of NYC’s most polluted areas (Midtown Manhattan) don’t have any continuous monitoring stations at all.
Accurate air quality data, and lots of it, is crucial in identifying room for air quality improvements. Without enough data, we can’t see if air pollution mitigation efforts like PlaNYC are actually improving air quality.
While COVID-19 will eventually pass, air pollution has been and will continue to be a significant health threat for everyone. Much like coronavirus testing, there’s no way to estimate our current air quality status without data. If we want to truly live in a happier, healthier world, we need to tackle air pollution, and we need reliable, well-maintained data sources to do that.
Kaiterra provides air quality monitors and an IAQ analytics dashboard for healthy buildings and offices, helping workplace leaders and healthy building pioneers assess and improve their indoor air quality. Our indoor air quality monitors like the Sensedge and the Sensedge Mini can be found in many of the world’s most iconic buildings and workplaces, such as the Empire State Building and the Burj Khalifa.


.png?width=306&height=226&name=Menu%20C%20(2).png)
.png)

