




If you're a workplace or real estate leader looking to improve your occupants' experience, sound is likely near the top of your list, and for good reason: acoustics is the most common indoor environment complaint in offices. Fixing noise issues starts with measuring them to find where and why they happen, and a continuous sound sensor is the most effective way to do that.
This guide covers how to choose the best noise sensor (also called a sound sensor) for your office, including which metrics to look for, how to tell if a sensor keeps conversations in your office private, and what to look for from a sound sensor vendor.
How Does Monitoring Sound Improve the Occupant Experience?
Tracking sound helps you create a better workplace for occupants by showing whether each space is delivering acoustic comfort, the match between how a space sounds and what the people in it need to do their work. That match is often missing: Leesman's research shows that 70% of employees call noise level an important workplace factor, yet only 35% are satisfied with it, a gap that has persisted through years of workplace investment and redesigns.
Acoustic comfort looks different from one space to the next:
- A focus area needs a steady, low background with few interruptions.
- A meeting room needs to be quiet enough for speech to carry clearly.
- A breakout or café area can run louder, as long as the sound stays fairly even.
Each of those needs depends on a different property of sound. Whether a space feels too loud, too changeable, or dominated by a hum or whine comes down to its level, variability, and frequency, which is why a sensor needs to measure all three.
A space's acoustic environment also shifts through the day as occupancy, meetings, and HVAC cycles change. Because those changes play out across the whole day, continuous sound monitoring is the only way to see when and where acoustic comfort breaks down, instead of relying on a single reading that may have caught a quiet moment.
What Should an Office Sound Sensor Measure?
Any sound sensor designed to evaluate acoustic comfort should report industry-standard acoustic metrics for level, variability, and frequency rather than a single decibel reading.
Most air quality monitors that claim to also measure sound usually only provide a decibel level. That figure shows how loud a space is, but not whether that sound is steady or full of interruptions, or which frequencies it’s made of, from a low hum to a high-pitched ringing. Without those details, it's hard to diagnose a complaint or find the right fix, because one decibel number is nowhere near enough to assess how a building is performing acoustically.
Measuring variability and frequency alongside level fills that gap. Here are the key metrics to look for in a sound sensor and what each one tells you:
|
Parameter |
Metric to look for |
What it tells you |
|
Level (A-weighted) |
LAeq |
The average sound level, weighted toward how people hear |
|
Level (C-weighted) |
LCeq |
The average sound level with low frequencies left in; a large gap above LAeq points to low-frequency sound like HVAC rumble or traffic |
|
Level (unweighted) |
LZeq |
The average sound level with no weighting, which captures all the sound energy in the room; comparing it with LAeq and LCeq shows how much sound each weighting filters out, mostly at low frequencies |
|
Peaks |
LAmax |
The loudest moment in each interval |
|
Background |
LA90 |
The level exceeded 90% of the time, or the room's noise floor |
|
Variability |
LA10 minus LA90 (the noise climate) |
How far sound swings between the background and intrusive activity like speech |
|
Frequency |
One-third-octave bands |
Where sound energy sits across the frequency spectrum, which helps point to likely sources such as HVAC, conversation, or equipment |
What Level of Analytics Do You Need From a Sound Sensor?
Once you know a sound sensor measures the right metrics, the next question is how it presents those readings, since data you can’t interpret won’t help you find the cause of a problem or the best solution. Many sound monitors stop at a live decibel reading or a simple time-series graph, which only shows when a space got louder, but not why.
More data doesn’t automatically mean better insights, either. If you have a solution that reports level, variability, and frequency around the clock, you can run into the opposite problem: all the right data, spread across thousands of readings per space each day, with no practical way to act on it using manual analysis alone.
Advanced software-driven analytics are what turn those readings into answers and, more importantly, action. Following the same framework we use for choosing a commercial air quality monitor, sound analytics generally fall into four levels:
|
Level |
What it provides |
Best suited to |
|
1. Raw data |
Unprocessed readings to download or feed into other systems |
Teams with in-house analysts or their own tools |
|
2. Basic visualization |
Time-series graphs showing when a space got louder or quieter, without interpretation |
A quick check on one or two spaces |
|
3. Advanced analytics |
Each space’s acoustic profile, background sound, fluctuation, and frequency breakdowns, with both portfolio-wide and room-level views |
Most commercial offices |
|
4. Insights and automation |
Trends, summaries, and recommendations surfaced automatically, with little manual analysis |
Large deployments across many spaces or buildings |
For a commercial office, look for at least Level 3. At that level, a platform should show:
- Background sound (LA90) separately from intrusive activity like speech, so you can tell a constant background hum from a busy team
- Fluctuation across the day, to see when a space swings from quiet to loud and how often
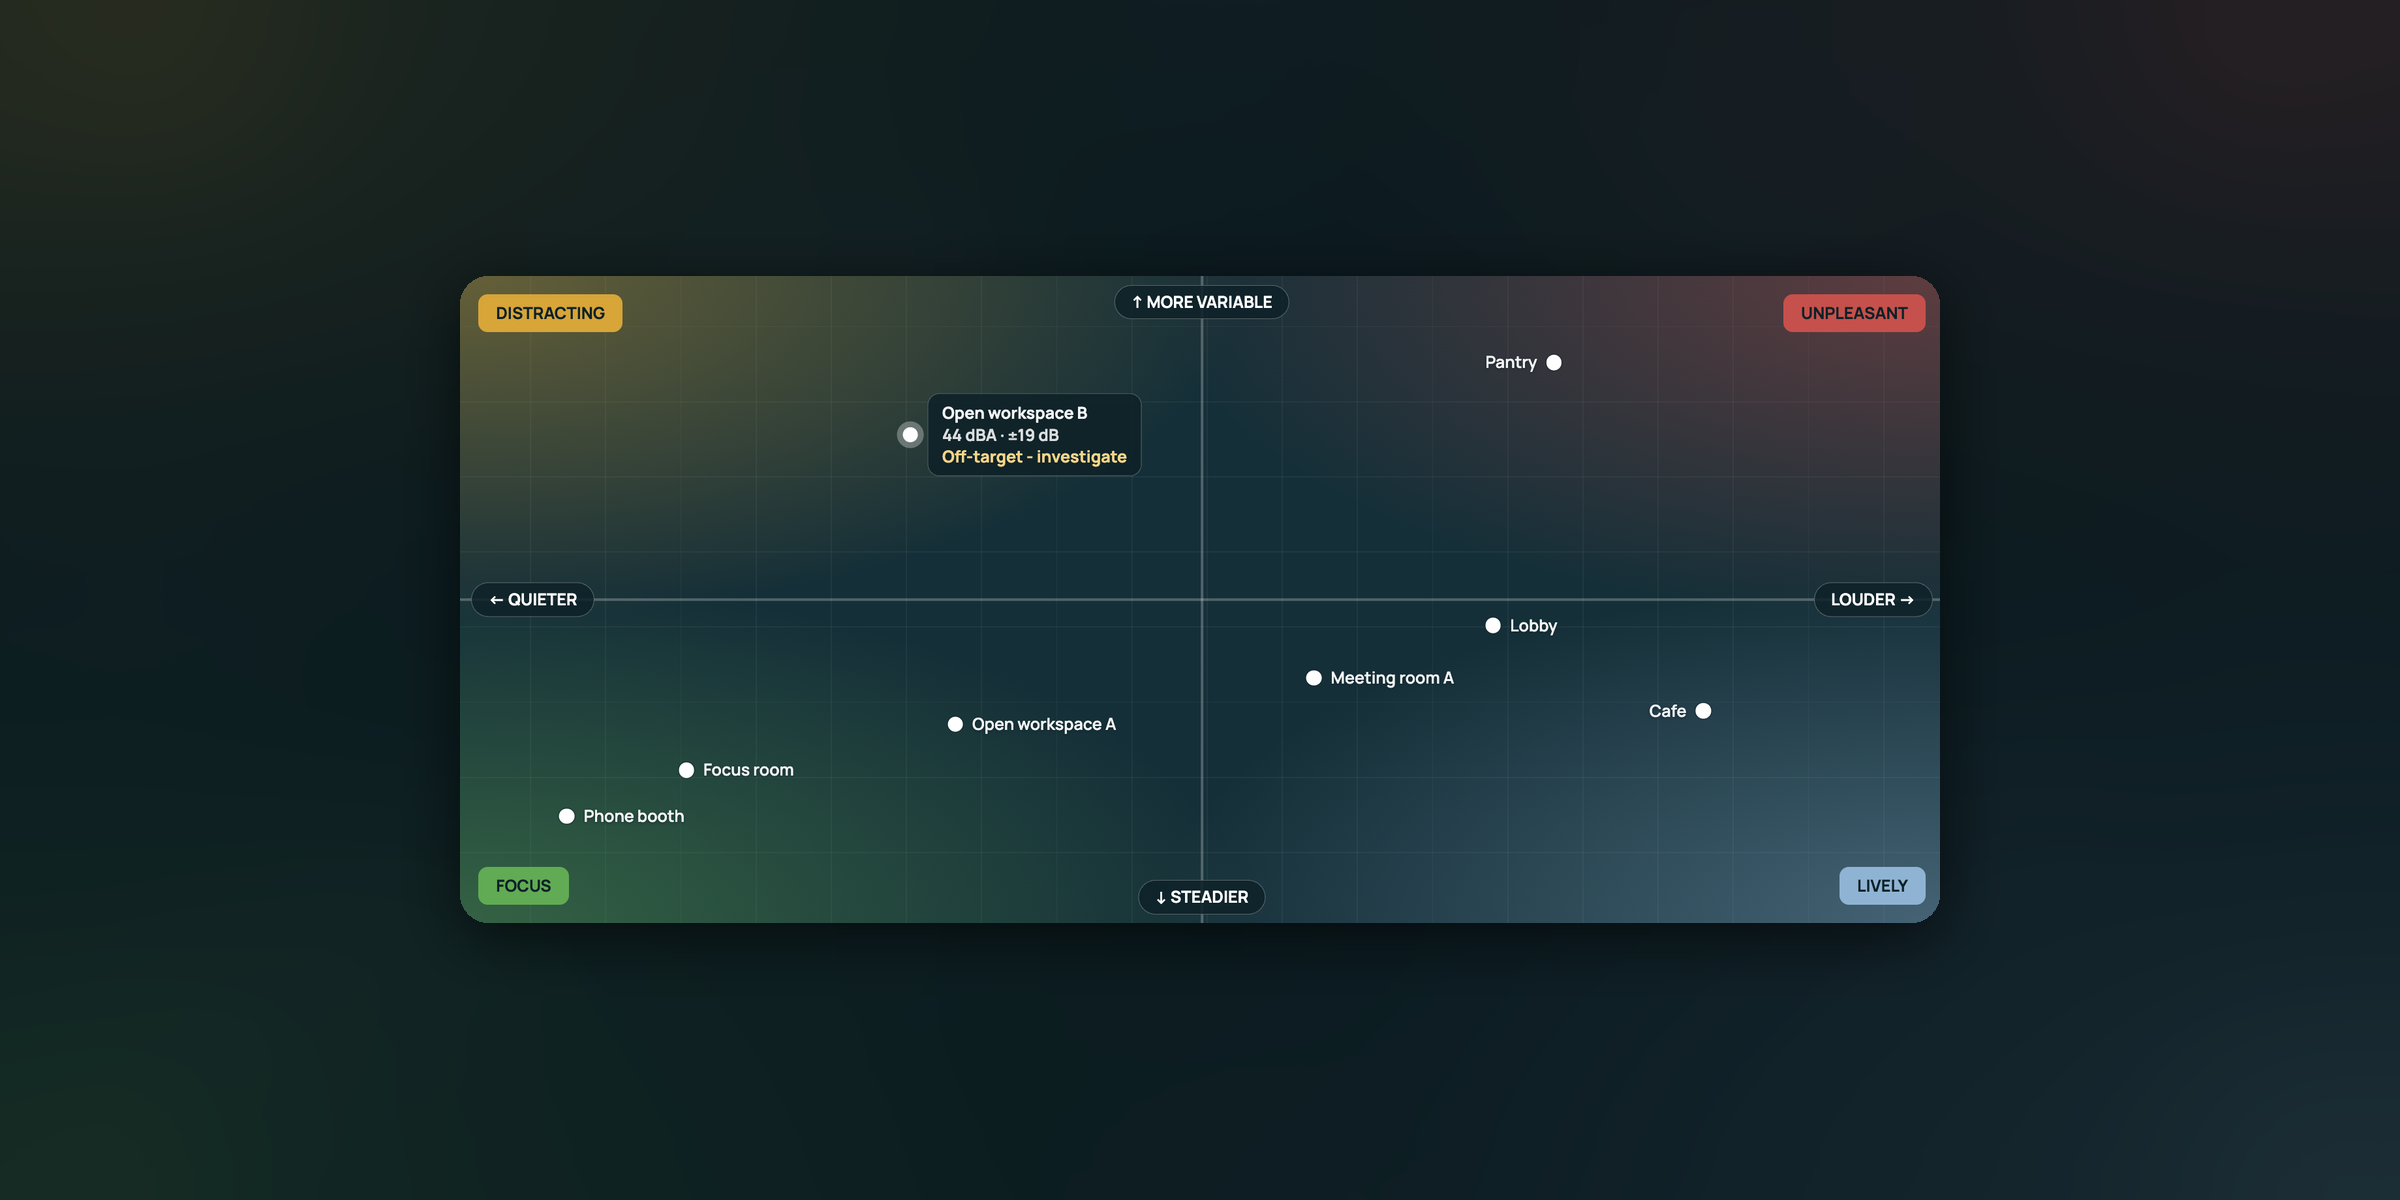
- Each space’s acoustic profile, its level plotted against its variability, to see at a glance whether it suits focus work or collaboration, or if it’s too loud or disruptive for work
- Frequency breakdowns that point to likely sources, such as a low-frequency rumble or a high-pitched whine from equipment, with one-third-octave band analytics to isolate tones
- Comparisons over time and across spaces, to decide where to act first, confirm whether a change worked, and benchmark acoustic comfort across days, weeks, and years
How Do You Know if a Sound Sensor Is Secure?
Whether a sound sensor is secure depends on how it's designed, specifically how often it listens, where the audio is processed, and whether or not it can save that audio. Privacy is one of the most common questions asked about sound sensors, since every sensor has to use a microphone to turn sound into an electrical signal that can be measured. While this introduces potential privacy risks, the right sensor design can mitigate those risks at every level. That includes:
- Listening time: The more of the day a microphone is switched on, the more speech it's exposed to. A sensor that listens in brief, fixed intervals takes in far less sound than one that runs nonstop.
- Audio handling: Raw audio is most exposed when it's stored or moved, for example, written to memory, passed to another chip, or uploaded to the cloud for processing. A sensor that turns audio into numbers right where it's captured, then discards it, gives that audio no opportunity to go anywhere else.
- Remote changes: A sensor's firmware (the built-in software that controls a device's components) decides how its microphone behaves. If that firmware can be rewritten from outside the device, a breach elsewhere in the system could, in theory, alter how often the sensor listens or how it handles audio.
A privacy-first sound sensor addresses each of these with:
- A short listening window that can't be changed after installation
- Audio converted to numeric readings on the device and discarded immediately, never stored or sent
- Sound processing kept separate from the parts of the device that connect to the network
- No path to reprogram the sound processing remotely
- Encryption and device certificates that verify each device's identity
- Written security documentation covering all of the above
What to Look For When Choosing a Noise Sensor
Use these criteria to compare sensors side by side, watching for red flags that may mean a sensor isn’t suited to your goals.
|
Criteria |
Green flag |
Red flag |
|
Parameters measured |
Level, variability, and frequency, reported as standard statistics such as LAeq, LA10, LA90, and a frequency spectrum, with readings throughout the day |
A single decibel number, an average level, or a one-time reading |
|
Data and analytics |
Insights for each space, including its acoustic profile, background sound, fluctuation across the day, and frequency breakdowns that point to likely sources, with comparisons over time and across spaces |
Only raw data, a live reading, or basic time-series graphs, with no interpretation of what’s driving the sound |
|
Microphone listening time |
A short, fixed listening window that can't be changed remotely |
Listening time set in software that can be updated |
|
Audio handling |
Processed on the sensor and discarded immediately, with nothing stored or sent |
Audio or audio clips sent to the cloud for processing |
|
Security documentation |
A written document covering hardware, firmware, and cloud security |
General assurances with no documentation behind them |
|
Integration with other IEQ monitoring tools |
If you're measuring other aspects of the indoor environment, look for a platform that easily integrates sound data to simplify your workload and enable cross-referencing |
A separate platform isolated from the rest of your IEQ data, requiring a separate dashboard, login, and analytics toolset |
Why Choose Kaiterra's Sound Sensor for Your Office?
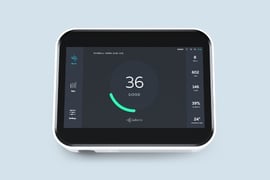
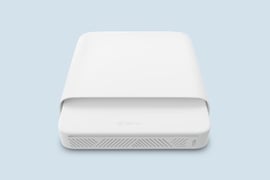
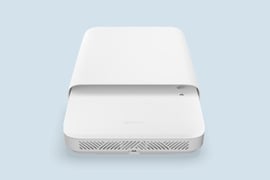
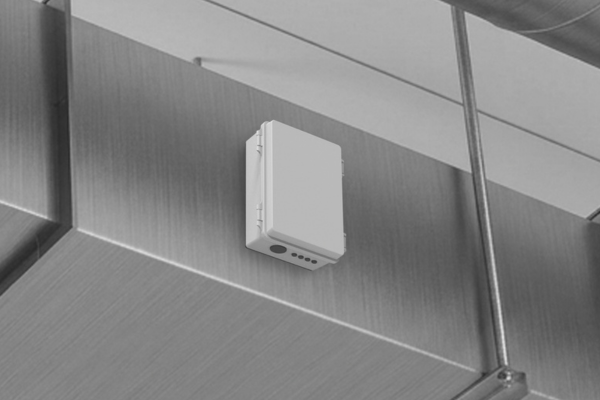
Kaiterra's sound sensor is built to deliver acoustic comfort without compromising your team's privacy or your workplace's security. It meets each of these criteria:
Continuous, Multi-Parameter Acoustic Data
Every minute, the sensor reports six acoustic statistics (LAeq, LCeq, LZeq, LAmax, LA10, and LA90), covering level, peaks, background, and variability. Every five minutes, it captures a 31-band one-third-octave spectrum from 20 Hz to 20 kHz, so you can trace sound to likely sources such as HVAC rumble, conversation, or equipment.
Built-In Security at Every Level
Kaiterra's sound sensor protects privacy with four layers of security, from the hardware to the cloud:
- 1. Listening time is fixed in hardware. The microphone listens for just 87 milliseconds of every second. That window is set by components on the circuit board, so no software or update can extend it.
- 2. Audio is converted to measurements inside the sensor. The sensor has its own processor, physically separate from the rest of the monitor. Audio is held only long enough to calculate readings, then discarded, so only numbers ever leave the sensor.
- 3. The sensor is locked down. The access port engineers would normally use to read or reprogram the sensor is permanently disabled, so its sound processing can't be changed after it leaves the factory. Data also flows one way, from the sensor out to the monitor, with no path back in.
- 4. The monitor and cloud are secured. Encryption and device certificates that verify each monitor's identity protect the data from the monitor to the Kaiterra platform.
Even if the sensor's firmware itself were compromised, the hardware limit on listening time would still prevent an audio recording. Because the microphone samples part of each second, averages and the LA10 and LA90 readings converge on their true values over days and weeks. That trade-off favors privacy, and a month of continuous data describes a space far better than an hour-long snapshot.
Real-Time Sound Analytics, Acoustic Profiles, and AI-Powered Insights
Kaiterra goes beyond raw data, offering advanced analytics as well as AI-powered insights and automation capabilities:
- Advanced analytics: The Kaiterra Data Platform automatically turns continuous sound data into an acoustic profile for every monitored space, so you can see at a glance which spaces are steady enough for focus work, which are lively, and which are distracting or unpleasant. From there, you can drill into LA10, LA90, LAmax, and the frequency spectrum to find what’s driving each space’s profile, and compare the same space over hours, days, and weeks to confirm whether a change moved it in the right direction.
- Insights and automation: With Kaiterra AI, now in early access, you can ask questions about your spaces in plain language, such as why a meeting room got louder last Tuesday afternoon, and get an answer that traces the change to its likely cause. It scans every space across your portfolio to surface what needs attention, and can turn its findings into a ready-to-share report. Teams that prefer their own AI tools can connect their Kaiterra data to assistants like Claude, Gemini, or ChatGPT through Kaiterra MCP.
Part of a 4-in-1 IEQ Platform
Sound data sits in the Kaiterra platform alongside air quality, thermal comfort, and light, so your workplace team can manage acoustic comfort with the rest of the indoor environment in one place. Cross-referencing sound with your other IEQ data surfaces patterns you’d otherwise miss, such as sound levels climbing alongside CO2 as a meeting room fills up. For large or global portfolios, the platform offers a high-level overview for a quick check across buildings, with the option to drill down into a specific space when something needs attention.
Want an Expert Opinion on the Right Noise Sensor for Your Office?
If you're not sure which sound sensor is best for your office, reach out to an IEQ expert on the Kaiterra team today. We're happy to walk you through how these criteria apply to your spaces, what your IT and security teams will want to see, and how continuous sound data can help you deliver acoustic comfort.