



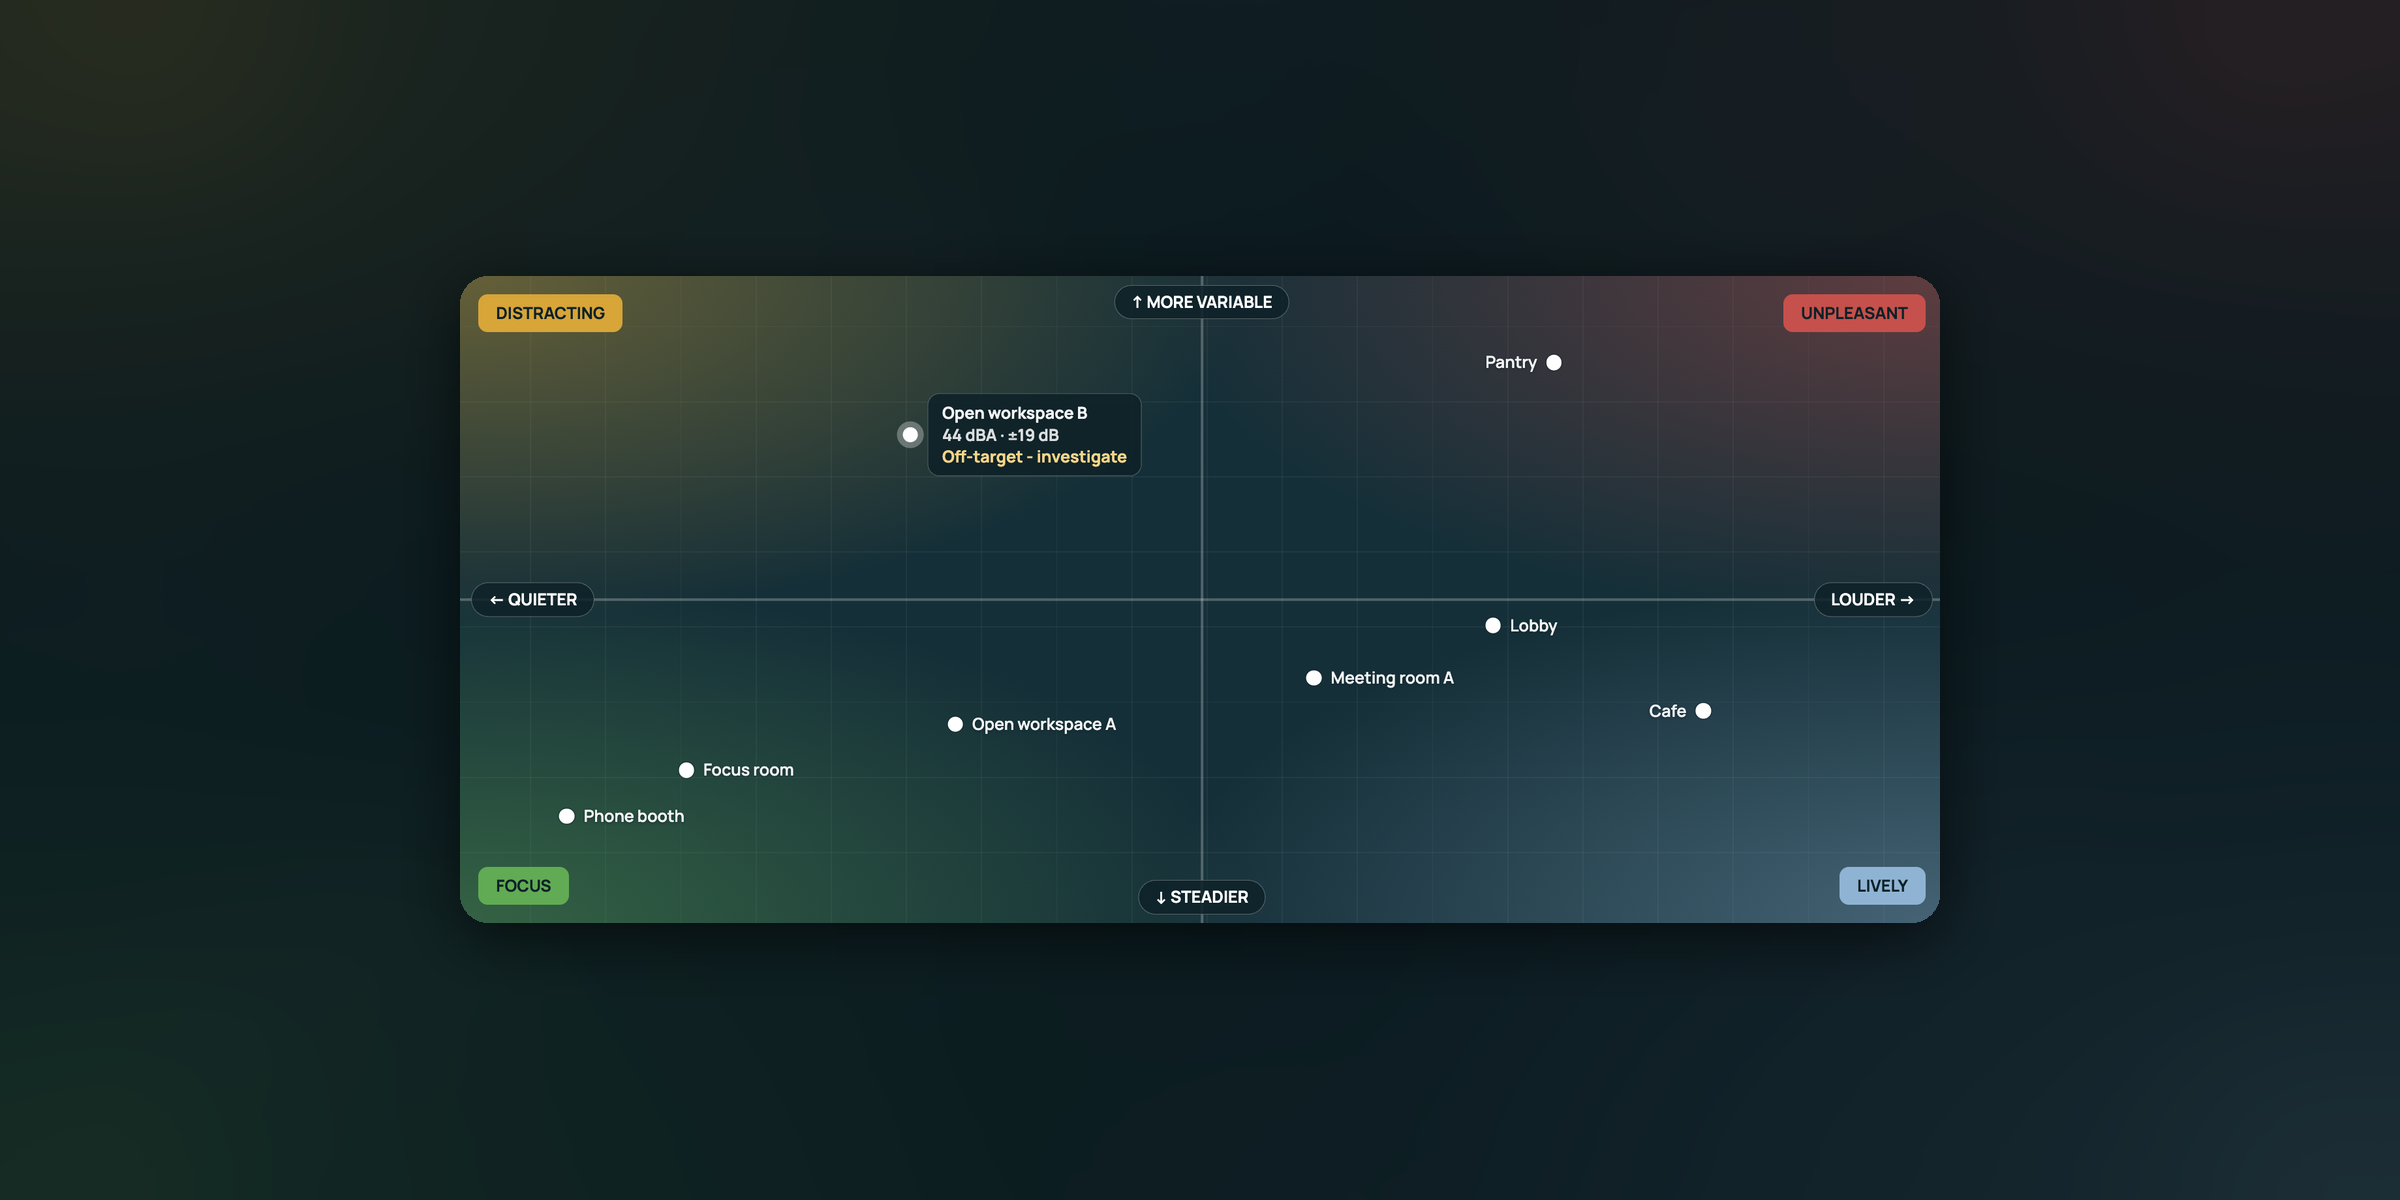
An office's acoustic profile is determined by how loud each space is and how much that sound swings over time. Two rooms with the same average level can feel completely different to work in, which is why sound level on its own can't tell you whether a space is delivering acoustic comfort.
Here’s how the Kaiterra Data Platform sorts every space into one of four acoustic profiles, which profiles most spaces should aim for, and how to pinpoint what’s pushing a space into the wrong one.
What Is an Acoustic Profile?
An acoustic profile compares the sound level and variability within a space to determine whether it's delivering acoustic comfort to the people inside. Every space has different acoustic requirements, so a profile that suits a break room can be wrong for a phone booth next door. The two measurements answer different questions about a space:
- Sound level (LAeq): how loud the space is overall. Out of the several sound level metrics Kaiterra measures, the acoustic profile uses the average level to represent how loud a space is across the day.
- Variability (LA10 minus LA90): how far the sound swings between its louder moments (LA10, the level exceeded 10% of the time) and its background floor (LA90, the level exceeded 90% of the time). A small spread means low variability (steady sound), while a large spread means high variability (frequent spikes above the background).
Why Isn't Sound Level Enough to Diagnose a Space?
Sound level tells you how much sound a space holds, but not whether that sound is steady or keeps breaking in, and that steadiness has a substantial effect on your ability to focus and work. A busy café can average louder than an office and still be easy to work in, because its sound is a constant buzz that the brain stops actively tracking. A quiet library where someone drops a heavy book every 30 seconds averages a far lower level, yet every crash pulls everyone’s attention away from their work.
The research points to the same trend:
- In memory tests, the amount of fluctuation in the background sound accounted for 55% of the variance in performance, more than half of the difference in how well people did, and a model built on that one factor correctly estimated the result in 63 of 70 cases.
- In listening tests, sound that rose and fell rapidly was as annoying as steady sound up to 11 to 12 dB louder (to most people, 10 dB sounds roughly twice as loud), with the effect starting at swings of around 2 dB.
- Sound level alone is generally estimated to account for only about 25% of the variance in how annoyed people are by a noise, leaving roughly three-quarters down to other factors.
How Does Plotting Level Against Variability Reveal a Space's Acoustic Profile?
Plotting sound level against variability places each space in one of four acoustic profiles, giving you a single view across your office. The horizontal axis runs from quieter to louder (LAeq), and the vertical axis runs from steady to variable (LA10 minus LA90). The Kaiterra Data Platform builds this map (like the one shown above) automatically from continuous sound data, with no manual calculations required.
Because every monitored space shows up on one map, your workplace team can see at a glance which spaces are working as intended and which aren’t, prioritize where to act first, and check back after a change to confirm a space moved into the right quadrant.
Here’s how the quadrants break down:
Q1: Unpleasant (High Level & High Variability)
Unpleasant spaces are loud and unpredictable at the same time, making them the hardest acoustic profile to work in. Examples include:
- An open-plan floor where several teams take calls at once over a raised background
- A hard-surfaced cafeteria where clattering trays and scraping chairs cut through loud conversation
- A team space next to active construction or a loading dock
- A lobby at peak arrival, with doors, footsteps, and announcements layered together
No space should be designed to sound like this, but the fix isn’t necessarily to make it quieter. The right solution will bring variability down, shifting a loud space toward the lively quadrant. Moving calls into enclosed rooms, adding acoustic treatment to soften sharp sounds like clattering trays, and separating work areas from intermittent building noise all help create steadier sound.
Q2: Distracting (Low Level & High Variability)
Distracting spaces are quiet on average but are frequently interrupted by sudden sounds. They often look fine on an average sound level reading alone. Common distracting spaces include:
- A quiet zone next to a pantry, where cupboard doors and the dishwasher keep breaking the silence
- A focus area beside a meeting room whose door opens onto it
- A desk row next to a printer or an elevator lobby
- A quiet floor where one person takes calls on speaker
Many spaces designed for focus (low level and low variability) easily end up in this distracting quadrant as interruptions become routine. Because their average level stays low, the shift often goes unnoticed unless sound is measured continuously.
Q3: Focus (Low Level & Low Variability)
Focus spaces are steadily quiet, with no loud spikes of noise. The background is low and even, so very little breaks in to pull attention away. Spaces that should have a focus profile include:
- Phone booths and focus rooms
- Library-style quiet zones
- Private offices with the door closed
- A heads-down bench at the far end of a floor, away from walkways
This is the ideal quadrant for people who prefer quiet surroundings for heads-down concentration work.
Q4: Lively (High Level & Low Variability)
Lively spaces are louder, but their sound holds at a constant buzz instead of spiking. For collaboration and social spaces, that energy is part of the design. That includes:
- A café-style breakout area with steady conversation
- A cafeteria or pantry at a busy but even hour
- A team neighborhood where people talk through work throughout the day
- A lobby or town-hall space as people gather
This is the ideal quadrant for people who work best with some background energy around them.
Recap: How the four acoustic profiles compare
|
Acoustic profile |
Sound level |
Variability |
Best suited for |
|
Q1: Unpleasant |
Louder |
Variable |
Not a design goal |
|
Q2: Distracting |
Quieter |
Variable |
Rarely a design goal |
|
Q3: Focus |
Quieter |
Steady |
Heads-down, individual work |
|
Q4: Lively |
Louder |
Steady |
Collaboration and socializing |
Which Acoustic Profiles Should Your Spaces Have?
In most cases, aim for the focus and lively profiles, where sound stays steady regardless of how loud the space is. Which of the two is right for a given space depends on what it's for.
That’s because people can have very different needs and preferences for sound level; even the same person can prefer different levels depending on the work they’re doing. In your own office, you probably know people who do their best work in a busy, lively space, and others who put on noise-canceling headphones and retreat to a quiet corner.
That's why the target is consistently low variability across your spaces, with sound levels that differ by purpose. A workplace with steady quiet rooms and steady lively ones gives everyone somewhere that suits how they work, while unpleasant and distracting spaces rarely serve anyone well.
How Do You Diagnose the Source of High Sound Variability?
When a space lands in a high-variability profile, Kaiterra’s other sound metrics show what’s causing the spikes and when they happen:
- Peak level (LAmax): the loudest moment in each minute shows how sharp the spikes are and when they hit, so you can match them to events like a lunch rush, meetings letting out, or a delivery window.
- Louder moments vs. background (LA10 and LA90): looking at each on its own shows whether high variability comes from frequent intrusive sounds or from a background so quiet that ordinary sounds stand out.
- Low-frequency sound (LCeq and frequency): sound level and variability are both A-weighted (adjusted to match human hearing, which is less sensitive to low pitches), which downplays low-frequency sound, so rumble from HVAC, equipment, or traffic can come and go without showing up clearly in a space’s profile. A large gap between LCeq and the average level (LAeq) flags this hidden low-frequency sound, and frequency data (the pitches where the sound energy sits) points to the likely source, from mechanical rumble to conversation in the speech range.
- Patterns over time: comparing the same space across hours, days, and weeks shows whether spikes follow a schedule or appeared after a change, like a team move or a new meeting room.
Once you know the source, follow the measure, treat, mask approach to choose the right solution, whether that's moving the noise source, adding acoustic treatment, introducing sound masking, or a combination.
Learn More About How Kaiterra Can Help You Deliver Acoustic Comfort
Acoustic profiling is just one of the many insights the Kaiterra Data Platform can surface with your continuous sound data. To learn more about how monitoring sound level, variability, and frequency can help you identify and fix sources of disruptive noise and deliver acoustic comfort in your office, reach out to our team today.